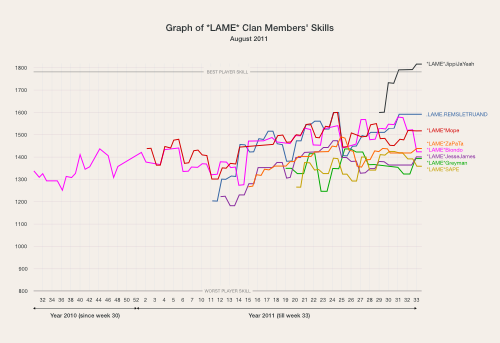
Based on BallerBude stats.
(Click on image for full size).
A bit of explanation.
In BB site you can see a player’s skills and a player’s ratio history clicking the tab “History”. In both graphs there are weekly markers for a whole year. Of course if someone changes PC/installation, the graph starts anew.
It’s difficult to compare graphs of different players because the X-axis has the same length no matter how many weeks it holds and the Y-axis of the graph is relative to the player’s skills (for example, it can go from a value of 1000 to a value of 1400, or from 1450 to 1750, and so on).
So I scaled and stretched our own curves and put them in an “absolute” grid.
It’s so messy that it’s difficult to read. What is clear is that –if you needed a confirmation– Jippi stands apart from us… too much skilled.
Don’t know what happened to ZaPaTa around February, his curve got totally flat (ZaPaTa are you a human??) 🙂
Update: In the first version of the graph I mistakenly downgraded ZaPaTa using data from his old installation. Now corrected with the most up to date data.
Normally, Skills have a very irregular progress. I’ll design a similar graph for Ratio next month (I expect a much more simple and legible graph).
cu

Searching for SPSS, I found a [quoted] named PSPP http://www.gnu.org/software/pspp/. I’ll give it a try, but my knowledge of statistical methods is very basic.
Hi Biondo. I saw this PSPP. Yes, it was similar than SPSS. I suggest to try it. Don’t affraid of it. At first It would be scarry, but I know You can do it.
Beyond that, I suggest find a good, basic statistics book, if it possible, It written on your native language.
If you have a good statistic software, it isn’t so complicated: If you know what value is important to you (forexample: deviation), and you know how to define the result, you can reach your target. So you couldn’t know the equation; this is the software’s work.
Very kind Sape, thank you! But keep in mind that I live in Linux, not in Windows. Thanks again.
When I worked in the University of Kaposvar, I used SPSS statistic software. It is too expensive, but I try to find a free statistycal software to you, if you interested in it.
I don’t have a statistical software, I just drew the whole thing in a drawing software (always the same: Inkscape).
Biondo, what kind of statistical softwer do you use?
Update: In the first version of the graph I mistakenly downgraded ZaPaTa using data from his old installation. Now corrected with the most up to date data.
Sorry, ZaPaTa!
OK, my mistake. I know some of us have 2 accounts and I tried to get only the most recent one, but with ZaPaTa I made a mistake. I’ll update the graph ASAP.
@Sape: good you have statistics knowledge. I haven’t so you can suggest corrections to my excursions in stats realm.
Got it, most of the time I play on one computer but I also play very rare on the other one. Jesse plays regular on both. explains it?
Maybe i got the reason for ZaPaTa graph: He have two accounts (one active and one non active). Biondo’s graph was taken from the non active account. (see graph above)
Hi.
Zap, I think I know the answer. The BB stat make “photo” in your skill twice a week. The graph can’t reflect your real skill. For example my best skill rate was 1518 (19th place), but I reached it the wrong time, so it doesn’t show the graph. (In my priviest workplace I make a lot statistic work. It was my tusk there).
I don’t know what it is, BUT. I might be at the bottom of the graph, I’m there at least with skills. Anyone ever tried making such a curve? I did and I’m the best in it.
Kidding, I don’t have a clue why it’s like that. (And why I’m there so beneath everyone else…)
The internet connection is very important, see my ping.
So, please see my skill carefully.
I have tried to uprise my ping to the average lame ping, but it didn’t work. I worked on it.
Heh, Zap, your graph is weird. Good for you, it’s not a cardiogram, it could look alarming that way.
My graph is upsetting. Have I reached my top? Can I rise above this level (without upgrading my internet connection)?